Recruitment dashboard guide: what to track and why it matters
 Roonan Lingam
17 min read
Roonan Lingam
17 min read

Hiring becomes hard when visibility breaks. As roles increase, updates spread across tools, interview notes sit in threads, and progress lives in people’s heads. Leaders lose a clear view of what’s moving, what’s stalled, and where decisions are waiting. At that stage, volume is not the problem. Clarity is. Leaders need to know which roles are stuck, where candidates drop off, and which actions will unblock hiring today.
A recruitment dashboard solves this directly. It consolidates applications, interview stages, time-to-hire, and offer status into one place. Not for oversight, but for decisions. With clear visibility, teams move faster, spot issues earlier, and keep hiring structured instead of reactive.
- Recruitment dashboards provide a single, shared view of hiring progress, bottlenecks, and outcomes across roles.
- Clear metrics and practical views turn dashboards into decision tools, not just reporting screens.
- Dashboards fail when data is stale, ownership is unclear, or teams rely on spreadsheets and workarounds.
- Regular reviews, standard stages, and clean data keep recruitment dashboards accurate and trusted.
- When used well, dashboards improve hiring speed, quality, alignment, and predictability across the recruitment process.
What is a recruitment dashboard?

A recruitment dashboard is a centralized view that shows the real-time status of open roles, candidates, and hiring stages. It helps hiring leaders quickly see what is progressing, what is delayed, and where decisions are pending when recruiting for multiple roles at the same time.
At its core, it consolidates all the data across open positions into a single view. This helps company leaders understand how the recruitment funnel is progressing, without relying on fragmented reports or manual follow-ups that slow decisions.
More importantly, a recruitment dashboard surfaces actionable insights. By measuring candidates across stages and tracking each candidate source, leaders can spot drop-offs early, adjust hiring goals, and align recruiting activity with broader business objectives.
Modern recruitment dashboards function like operational dashboards. With clear recruitment dashboard metrics and recruitment dashboard KPIs, they support faster decisions on when to reject candidates, where to invest effort, and how to keep hiring on track using a recruitment analytics dashboard.
Why recruitment dashboards matter in modern hiring

Recruitment dashboards matter in modern hiring because they give teams real-time visibility into progress, delays, and decision gaps. As hiring volume increases, speed and quality can drift apart without clear signals. A recruitment reporting dashboard keeps HR teams, hiring managers, and recruiters aligned, helping them identify issues early and prevent small delays from turning into missed hires.
- Stops status ping-pong: A recruitment dashboard for HR answers “how many candidates” are in each stage, so hiring managers stop asking for updates. Recruiting dashboards turn job postings into a clear queue, with owners, next steps, deadlines, and recruitment metrics.
- Finds bottlenecks early: In the hiring process, one slow interview panel can stall everything. A recruitment performance dashboard highlights stage time, pass-through rates, and drop-offs, so the recruiting team fixes the exact step causing delays across the recruiting process.
- Protects quality at speed: When volume spikes, teams rush and miss qualified candidates. A recruitment reporting dashboard shows conversion by role and source, so hr teams can tighten screening, refresh job postings, and keep standards consistent across the recruitment process.
(Source: Gallup)
- Keeps spending honestly: Without visibility, cost per hire creeps up quietly. Recruiting dashboards connect sourcing spend to outcomes, so leaders can compare channels by role, spot waste quickly, and reinvest where the recruiting process actually produces offers and acceptances.
- Improves the candidate journey: A messy handoff shows up as ghosting and no-shows. A hiring dashboard tracks response times, scheduling friction, and candidate experience score signals, so the team can fix communication gaps early in real time for every role.
Once you understand why recruitment dashboards matter, the next question is what they actually look like in practice. Different hiring goals demand different views. Up next, we’ll walk through real examples of recruitment dashboards and what each one helps you see.
8 Examples of a recruitment dashboard

A recruitment dashboard shows how different parts of the hiring process perform in real time. These examples illustrate how specific views help teams track progress, spot bottlenecks, compare roles, and make faster decisions using structured recruitment data instead of retrospective reports.
1. Recruitment dashboard
This view answers what a recruitment dashboard is in practice. It gives the recruitment team a shared snapshot of hiring data across roles, stages, and owners. For recruiters, it replaces scattered recruiting data with a recruitment dashboard for recruiters that supports daily prioritization and clearer handoffs.
Used well, it becomes the foundation for how to build a recruitment dashboard that reflects real hiring behavior. Regular data quality audits keep the hr recruitment dashboard reliable as volume, roles, and workflows change.
2. Recruitment KPIs
Recruitment KPIs translate activity into direction. Instead of vanity counts, they highlight recruitment dashboard metrics that matter, such as pass-through rates, stalled stages, and hiring velocity by role. Recruitment managers use this view to course-correct before targets slip.
Over time, these KPIs anchor the recruitment strategy. They show whether changes in sourcing, screening, or interviews actually improve outcomes across the application or interview process.
3. Careers page analytics
Careers page analytics connect intent to action. They show how visitors move from job postings into the application or interview process, revealing friction points that quietly shrink pipeline quality before recruiters ever engage.
For recruitment teams, this data explains why strong job postings still underperform. It links recruiting data to early-stage drop-offs, helping teams adjust messaging, role clarity, and expectations upstream.
(Source: Gallup)
4. Time-to-hire and time-to-fill metrics
Time to hire exposes speed without context, while time-to-fill shows demand pressure. Together, they explain whether delays come from sourcing gaps, interview bottlenecks, or decision lag within the interview process.
In a hr recruitment dashboard, these metrics help recruitment managers balance urgency and quality. They also surface when hiring data points to structural issues, not individual recruiter performance.
5. Candidate funnel conversion rates
Funnel conversion rates show where interest turns into progress or stalls. This view clarifies how candidates move through each stage of the application or interview process, without relying on anecdotal feedback.
For the recruitment team, conversion data highlights where expectations misalign. It helps recruiters refine screening, interview structure, and handoffs using real recruiting data rather than assumptions.
6. Source of hire performance
Source performance shows which channels deliver hires, not just volume. It connects recruiting data to outcomes, revealing which sources sustain quality through the interview process and which inflate early-stage noise.
This insight shapes recruitment strategy. Recruitment managers can rebalance effort and spend based on hiring data that reflects long-term success, not short-term application spikes.
7. Interview and offer acceptance rates
Interview and offer acceptance rates reflect trust and clarity. Drops here often signal misaligned expectations, rushed interviews, or weak role framing earlier in the application or interview process.
In a recruitment dashboard for recruiters, these rates help isolate experience issues quickly. They give teams a clear signal on where candidate confidence breaks down before joining decisions.
8. Hiring manager feedback and satisfaction
Hiring manager feedback closes the loop between process and outcome. It shows whether the recruitment dashboard metrics that matter actually support decision quality and speed for recruitment managers.
When paired with diversity hiring metrics and hiring data, this feedback helps the recruitment team adjust workflows. It ensures the dashboard supports collaboration, not just reporting.
These examples show how dashboards answer different hiring questions. But clarity only comes from tracking the right numbers consistently. Next, we’ll break down the key metrics every recruitment dashboard should track and why each one matters.
Key metrics every recruitment dashboard should track
Key metrics matter because they show whether hiring is progressing as planned or breaking down. A real-time recruitment dashboard highlights these signals early, helping teams focus efforts, identify risks, and make timely decisions instead of reacting after problems appear in reports.
- Number of candidates: Track the number of candidates in each stage to understand the true candidate pool. This is the baseline for recruiting performance, and it prevents teams from mistaking noise for progress when volume spikes.
- Time to fill: Time to fill shows how fast roles close, and where delays live. An effective recruitment dashboard, it highlights bottlenecks early and keeps recruitment efforts aligned to hiring pressure, not guesswork.
- Acceptance rate: Acceptance rate signals whether offers match market expectations. A falling acceptance rate often points to slow cycles, weak role framing, or compensation mismatch, and it directly impacts candidate retention risk early.
(Source: Gallup)
- Candidate satisfaction score: Candidate satisfaction score captures how candidates feel during the process. It is a practical proxy for candidate experience, and it often predicts drop-offs, ghosting, and offer declines before recruiters see them.
- Stage conversion rates: Track conversion across stages to spot where quality drops. Effective recruiting dashboards show which steps leak candidates, so teams fix the interview flow, feedback speed, or screening bar without disrupting everything.
- Recruiting performance by role: Compare hiring velocity and pass-through rates across roles. This helps a recruitment dashboard for hiring managers spot which roles need tighter screening, better sourcing, or faster decisions based on outcomes.
- Data accuracy checks: Data accuracy is what makes the dashboard trustworthy. A recruitment dashboard vs ATS reports comparison often shows dashboards win on clarity, but only if teams maintain clean stage definitions and consistent updates.
- Recruitment dashboard KPIs explained: Keep a short set of KPIs tied to decisions, not vanity. Recruitment dashboard KPIs explained well will show which levers improve recruiting performance and which metrics simply describe activity.
Even strong metrics can fail when teams track the wrong things, interpret them loosely, or treat the dashboard like a reporting wall. Next, we’ll cover common mistakes teams make with recruitment dashboards and how to avoid them.
Common mistakes teams make with recruitment dashboards

Teams make mistakes with recruitment dashboards when data is outdated, ownership is unclear, or metrics are poorly defined. These issues slow hiring speed, confuse handoffs, and hide problems with candidate quality. Identifying these mistakes early is critical to keeping recruitment analytics reliable and useful for decisions.
- Treating it like Microsoft Excel: Teams rebuilds dashboards in Microsoft Excel, then loses version control. HR managers waste time reconciling sheets instead of improving hiring speed, and recruitment analytics becomes a monthly clean-up exercise, not a real decision tool.
- Ignoring data warehouses: When data warehouses are not connected, every view is partial. Human resources ends up with mismatched counts, shaky trend lines, and debates about truth, which slows schedule interviews and hides team performance issues.
- Blending channels into one bucket: A single “source” label masks what a recruitment channel actually delivers. You cannot separate candidate quality from volume, so teams chase the loudest channel instead of the one that produces quality candidates.
- Optimizing only for speed: Chasing hiring speed alone pushes rushed screens and weak calibration. Candidate quality drops, salary expectations get missed, and late-stage declines rise because the process moved fast but did not build confidence.
- Not measuring candidate satisfaction: Teams track stages but skip candidate satisfaction. That hides friction in how you schedule interviews, communicate delays, and close loops, even though those moments shape candidate satisfaction and drop-off rates quickly.
- Letting ownership stay vague: When nobody owns updates, fields stay stale. HR managers assume progress is happening, but the pipeline is outdated, so team performance reviews become reactive and human resources loses trust in the dashboard.
- Using analytics without context: Recruitment analytics shows patterns, not reasons. Without notes on role changes, salary expectations shifts, or market spikes, teams misread trends and make changes that hurt candidate quality instead of improving outcomes.
If these mistakes feel familiar, you do not need a new tool first. You need simple habits that protect data quality and keep dashboards current. Next, we’ll cover best practices for maintaining an accurate recruitment dashboard, day to day.
Best practices for maintaining an accurate recruitment dashboard
Maintaining an accurate recruitment dashboard requires consistent data updates, clear ownership, and reliable integrations. When dashboards reflect real-time hiring activity, HR leaders can trust the signals they see, track candidates accurately, and make decisions based on what is actually happening, not outdated information.
- Lock the data source: Define one data source per metric, and document it. When hr systems and trackers disagree, pick the system of record. This prevents duplicate counts, broken conversion rate trends, and confusion about what “in interview” really means.
- Standardize stage rules: Agree on stage names and entry criteria across teams. Consistent pipeline conversion rates depend on clean stage logic, not recruiter preference. It also makes sourcing strategies easier to compare because every role follows the same flow.
- Automate real-time data feeds: Reduce manual updates from Google Sheets and Google Sheets exports. Use integrations from hr systems so custom dashboards reflect changes instantly. Less manual work improves accuracy and protects recruiting metrics from stale status updates.
- Run weekly quality checks: Set a short audit cadence to spot missing owners, stale stages, and duplicates. These checks help identify areas where fields are slipping, and they keep pipeline conversion rates and offer acceptance rate reporting trustworthy for hr leaders.
- Use simple visuals first: Start with bar charts for stage volume, aging, and conversion rate by role. Clear visuals make issues obvious. Custom dashboards should highlight a few recruiting metrics that drive decisions, not overwhelm teams with noise.
- Track acceptance signals early: Monitor offer acceptance rate alongside stage speed. When acceptance dips, it often reflects role clarity or market mismatch. Keeping this visible helps talent acquisition adjust outreach and expectations before late-stage drop-offs happen.
Once your data is clean and current, patterns become easy to spot. That’s where analytics stops being reporting and starts guiding action. Next, we’ll show how Hummer AI surfaces meaningful hiring patterns from recruitment dashboard data, automatically.
How Hummer AI surfaces meaningful hiring patterns from recruitment dashboard data
Hummer AI is a co-pilot for hiring leaders: it reads the dashboard while you run the process. Instead of scanning multiple reports and debating what changed, it highlights the pattern that matters and the likely cause. That contrast turns effective recruiting dashboards from “views” into next actions.
- Cuts through multiple reports: Hummer AI consolidates signals that usually live across multiple reports, so leaders stop reconciling mismatched numbers. It frames the story behind movement, not just counts, making effective recruiting dashboards easier to act on in weekly hiring reviews.
- Explains anomalies, not averages: When a stage suddenly slows or quality dips, it flags what shifted and where. This is where the recruitment dashboard vs ATS reports becomes clear: ATS reports list activity, while Hummer AI interprets the change and its impact.
- Turns patterns into playbooks: Using recruitment dashboard examples as references, it suggests next steps tied to the pattern. For instance, it can recommend tightening screens, rebalancing interview load, or adjusting sequencing, based on where the pipeline is leaking today.
- Surfaces the “why” behind outcomes: It links outcome changes to upstream behavior, like delayed feedback or inconsistent screening. That makes effective recruiting dashboards more than a mirror. They become a guide that points to the lever worth pulling first.
- Keeps leadership updates crisp: Instead of a dashboard tour, Hummer AI generates a short narrative for hiring leaders. You get what changed, why it likely happened, and what to do next, without digging through multiple reports or creating manual summaries.
Conclusion
A recruitment dashboard brings order to one of the most complex systems inside an organization: hiring. When roles scale, teams grow, and timelines tighten, visibility stops being a nice-to-have and becomes essential. A clear dashboard helps leaders see what is moving, what is blocked, and where effort is being wasted.
It aligns recruiters, hiring managers, and HR around the same signals, reducing guesswork and reactive decisions. Most importantly, it turns hiring from a series of updates into a process that can be steered with intent.
That value compounds when intelligence is layered on top. Hummer AI does not just display recruitment data. It reads patterns across stages, roles, and time, and explains what actually changed and why. Instead of scanning charts or reconciling reports, teams get clear direction on where to act. In practice, this means faster decisions, fewer surprises, and a hiring process that improves continuously, not just at quarter-end reviews.
FAQs
1. What is a recruitment dashboard used for?
A recruitment dashboard is used to keep the hiring process visible and steerable. It shows pipeline health, stage progress, and where decisions are stuck. Leaders can prioritize roles, unblock interviews, and align recruiters and hiring managers on the same page. The goal is fewer status meetings and faster, better choices from shared signals every week.
2. What metrics should never be missing from a recruitment dashboard?
Never miss role status, number of candidates per stage, time to fill, stage conversion rates, and offer acceptance rate. Together, these metrics show speed, quality, and risk. Without them, teams may track activity but miss bottlenecks, weak pipelines, and late-stage fallout. Add source performance and aging by stage per role for sharper action weekly.
3. How often should recruitment dashboard data be reviewed?
Review recruitment dashboard data weekly for steady hiring, and daily during high-volume pushes or urgent roles. Frequent review keeps stages current, prevents silent stalls, and helps managers reassign interview load quickly. Monthly reviews are too slow because small delays compound. A short weekly cadence plus quick ad-hoc checks usually wins long-term each week.
4. Are recruitment dashboards useful for small hiring teams?
Yes. For small hiring teams, dashboards reduce manual tracking and protect focus. When bandwidth is limited, you cannot afford hidden delays or repeated status pings. A simple dashboard clarifies who owns each step, what’s blocked, and which roles need attention today. It also helps you spot patterns early, with less admin work for everyone.
5. What’s the difference between a recruitment dashboard and ATS analytics?
ATS analytics mainly report activity inside the ATS, like applications received, interviews scheduled, and time stamps. A recruitment dashboard connects those signals across roles and time, often combining hiring data from other tools. It highlights trends, bottlenecks, and outcomes for decisions. In short, ATS analytics show logs; dashboards show the story and what to do next.
6. Can recruitment dashboards help reduce hiring bias?
Yes, if used thoughtfully. Dashboards can reveal uneven pass-through rates by stage, role, or source, prompting teams to review rubrics and interview consistency. They also reduce reliance on gut feel by grounding decisions in shared metrics. Pair dashboard signals with structured interviews and clear criteria. Dashboards help you detect bias patterns, not eliminate bias alone.
7. Who owns the recruitment dashboard: HR, recruiters, or leadership?
Ownership should be explicit and shared. Recruiters typically keep stage updates accurate, HR sets definitions and governance, and leadership uses the dashboard for decisions and prioritization. If nobody owns data quality, trust collapses and teams revert to spreadsheets. Assign a single dashboard owner for hygiene, plus clear contributors for each stage to keep it current.
8. What are common signs that a recruitment dashboard isn’t working?
Watch for stale stages, conflicting counts, and constant questions like “Is this accurate?” If teams export to slides, rebuild in spreadsheets, or rely on anecdotes, the dashboard isn’t trusted. Another sign is surprise delays or offer declines despite “healthy” views. When insights don’t change actions in weekly reviews, it’s reporting noise, not a management tool.
More from HummerAI Blog
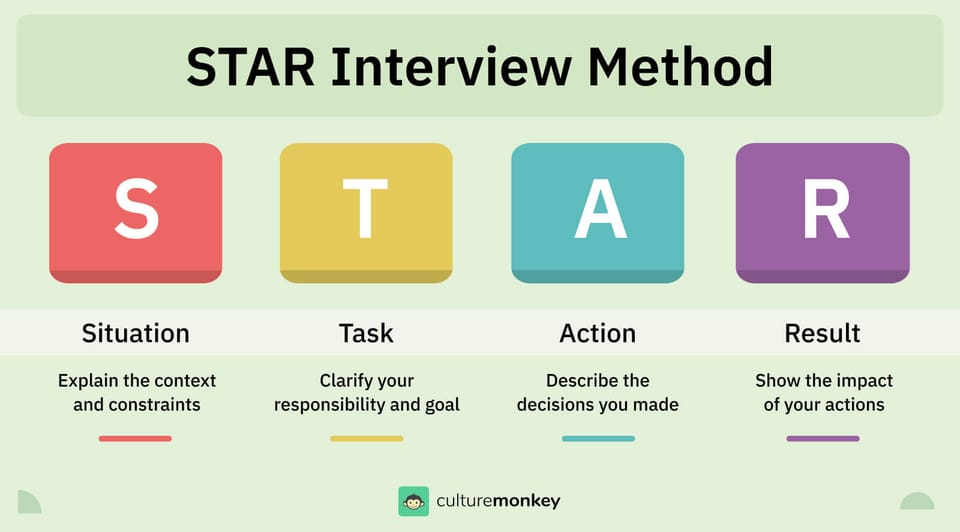
STAR method interview questions: How to answer them with real examples
STAR method interview questions are structured prompts that ask candidates to explain a situation, action, and result to assess real past behavior clearly.

Interview copilot guide for recruiters and hiring managers
An interview copilot is an AI assistant that supports interviewers during live interviews by providing real-time guidance, automated note-taking, and structured summaries, helping teams evaluate candidates consistently while keeping human judgment.